The FM Monitor is a large data pool for operating costs in Switzerland. It offers owners, asset managers and operating specialists the opportunity to compare their properties with the market. We talk to Fabio Staub, FM Monitor Product Manager, about the relevant key figures, cost transparency and current trends.
FM Monitor is almost as old as pom+ itself: for around 25 years, it has been systematically collecting and analysing data on operating costs and space efficiency, and has established itself as an important tool in real estate controlling. Comprehensive cost and space metrics are determined annually for a total of 13 property types from different sectors, providing a sound basis for strategic decisions.
The FM Monitor is also becoming increasingly important in the context of sustainability. Sustainability certifications not only assess the ecological footprint of buildings, but also their economic operation. Low energy consumption and optimised processes are key factors for resource-conserving and efficient building operation in the long term.
At the same time, the FM Monitor enables management costs to be analysed precisely. By comparing services with an extensive benchmarking pool, it provides valuable insights. These form the basis for detailed cost analyses, well-founded resource calculations and process optimisations - and thus create a solid foundation for the development of efficient internal billing concepts.
Fabio, why is real estate controlling becoming increasingly important?
Real estate controlling ensures transparency in economic efficiency and enables continuous monitoring of operations. It helps to recognise risks at an early stage and to plan long-term investment strategies in a targeted manner - especially in view of growing sustainability requirements.
In addition, property controlling enables systematic budgeting of costs and provides the basis for benchmarking with relevant market participants. But it is also about organisational performance: What processes and services are behind the figures? Where is there potential for optimisation?
Property controlling should be set up in such a way that opportunities can be identified, measures developed and implemented over time.
Which key figures are particularly relevant?
Management costs and space efficiency are among the most popular KPIs, but they are not the only ones that are relevant.
In planning and construction-related FM (PBFM) in particular, precise space analysis is crucial to ensure the economic viability of a project. For yield-producing properties, the ratio of the main usable area (HNF) and ultimately the floor area is an essential key figure. Ultimately, the rentable area provides information on how efficiently a property is being utilised.
If basic space ratios are not met, the profitability of a project can be jeopardised. In extreme cases, this can even lead to a project not being realised or financed because the expected income cannot be achieved. A well-founded and systematic benchmarking comparison helps to recognise such risks at an early stage and take targeted countermeasures.
Ah yes, the property industry and its obsession with comparisons...
Comparative values are essential in order to realistically categorise operating costs and service quality. For the public sector, the focus is on cost efficiency, while for institutional owners and investors, a balance between costs and service quality is crucial.
Corporate real estate management also focuses on the efficiency, costs and quality of its own property management. A comparison provides an objective assessment, identifies weaknesses and allows best practices to be derived. Benchmarking often also supports internal discussions and decision-making processes and ensures that market standards are implemented and further developed.
A purely internal comparison within your own portfolio can certainly help to recognise patterns and identify optimisation potential. However, in order to make well-founded decisions, it is essential to look beyond your own portfolio. A comparison with other market participants shows where there are deviations, whether cost structures are appropriate and which best practices have proven their worth. Only through broader benchmarking can a property organisation ensure that it not only operates efficiently, but also remains competitive in the long term.
What specific findings can be derived from this process?
That depends on the benchmark selected. We take into account different cost structures, for example by utilisation class for property investments or for operating properties and administrative assets. In both cases, a comparison of the analysis data covered in the FM Monitor shows where the values of a property or a portfolio lie, how large the gap to the median is and which are the ‘best in class’ properties.
What opportunities and pain points can be addressed with the FM Monitor?
Property owners and administrations face the challenge of recording and analysing their management costs in detail. Accounting is often not directly aligned with an operating cost model, which makes transparent cost control difficult. The FM Monitor helps to systematically break down this data and classify it in a standardised benchmarking system. As this mapping is carried out across a large number of market participants, harmonised benchmarks can be generated.
In addition, portfolio holders want to understand how cost structures develop over the years and what trends are emerging. For example, it may turn out that disposal costs or energy costs are higher than average because other market participants have already implemented more efficient solutions. Administrative costs (make-or-buy) are also a recurring topic - the FM Monitor shows where there is potential for optimisation and how cost structures can be improved in the long term.
How does participation in the FM Monitor work?
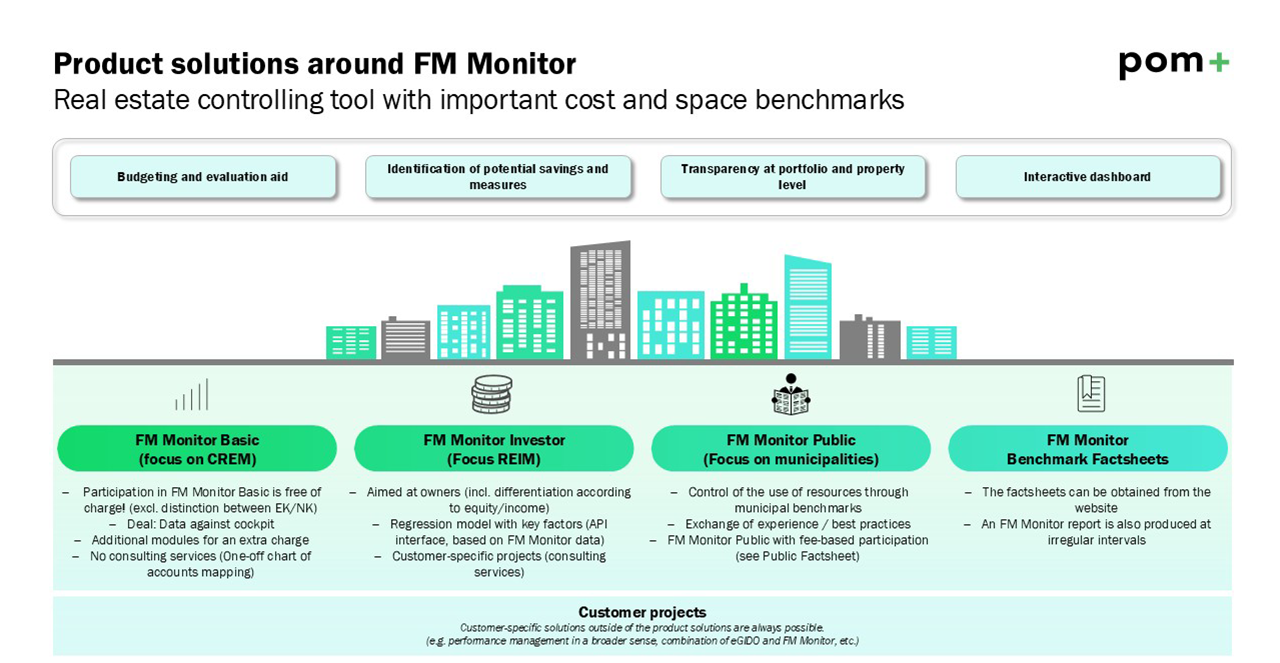
Participation in the FM Monitor is simple and requires minimal effort. All that is required are exports from existing systems - such as master data, floor space data, cost data and the accounting chart of accounts. We prepare the data so that the administrative effort for participants remains low. No consulting services are provided with FM Monitor Basic. Instead, data is provided in exchange for a dashboard. The schedule is also fixed and the cost structure is only suitable for CREM/PREM organisations (‘Basic package’).
For more in-depth support and advice, individual analyses or customised dashboards (with additional KPIs, etc.), we discuss the individual needs together in a kick-off and determine the course of the project according to customer requirements.
Are you interested in the FM Monitor? You can take part in the current benchmark yourself or order the latest market comparison. For a daily updated analysis, our benchmarks can also be individually integrated directly into your own IT system landscape via an API interface and thus linked to a real estate management tool, for example.
We will be happy to advise you.